
Many tools can be used for data analysis, but combining them can yield high results because different tools can accomplish various tasks. Both Python and Excel are excellent tools that can be used in analyzing data individually but combining them enhances data analysis capabilities. There are many ways in which Python and Excel can be integrated to enhance data analysis some of the ways include:
Powerful Libraries like pandas and matplotlib can be used in accessing data directly in Excel which enhances advanced data analytics i.e. forecasting, optimization, and clustering of the data that is stored in excel. In the field of visualization, some charts can be drawn in Excel but others cannot be plotted easily. Integrating Python with Excel makes it easy to draw different kinds of charts that are not found in Excel such as pair plots, box plots, and network graphs by leveraging the Python visualization libraries. In machine learning, it will make it possible for the models and predictions to be carried out in Excel using Python thus enhancing the data prediction capabilities. Let’s explore how Python and Excel can be integrated to enhance data analysis.
Introduction to Python in Excel
Python programming language is one of the most used programming languages that is used and loved across various fields including businesses, education, family and personal use. On the other hand, excel is a tool that can be used to organize data, and store data for analysis and manipulation. With these tools being good for data analysis there has been no clear way of integrating them so that they can work together. This article explains the step-by-step process and the libraries that can be used in integrating Python into Excel. The Python code can now be written in Excel cells using the PY function that is found in Excel. This enables one to perform the operations that are complex or cannot be performed by the Excel functions. Another function that can be used by Python to access data from the Excel cells is the X1 function. This makes it easy for the data in Excel to be manipulated using Python. Python language can also be used in Excel to automate repetitive tasks thus saving time and increasing the efficiency of the process of managing any data in the Excel file.
Setting Up Python in Excel
Python can easily be integrated into Excel through simple steps as shown in the following sections.
To insert Python in Excel, select the Python cell go to the formula section and then insert the Python function this shall tell Excel that the Python code wants to be written. The following figure shows the process that is involved.
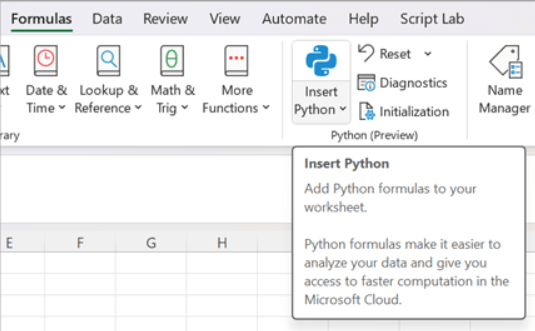
Figure 1: Python inserted in Excel.
Another way in which Python can be inserted in Excel is through using the PY function. PY is typed in an Excel cell and the user shall be prompted to active python. Once Python is activated python code can be written on those cells. The following figure shows how this can be done.
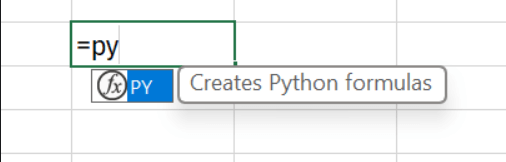
Figure 2: Python function inserted.
X1() function can also be used in inserting Python into Excel as shown in the following figure.
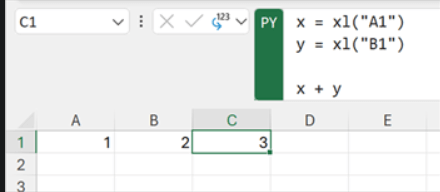
Figure 3: Inserting python using X1() function.
Key Features and Capabilities
Integrating Python with Excel offers key features and capabilities that can be used in advanced data analysis. Some of these features and capabilities include the following:
- Python uses powerful libraries like Pandas and Matplotlib which are used for statical data analysis and others like Seaborn are used for advanced data visualization.
- In natural language analysis Excel can generate and allow Python code to be inserted simplifying the process of advanced analytics.
- Advanced visualization, through integrating the two tools, advanced charts like network graphs which are not found in Excel can be plotted using Python libraries like pandas and matplotlib.
- Enable access to Python machine learning capabilities using different models that will enhance data forecasting, prediction, optimization and clustering.
- Python in Excel runs on the Microsoft cloud which has high enterprise security this shall ensure data privacy and security.
Practice user cases
Leveraging Python with Excel can be applied in various user cases for advanced data analysis. Some of them include the following.
- Creation of machine learning models in Excel using Python libraries like pandas and sci-kit-learn library enhances data partitioning and model learning with the Excel document.
- Python in Excel can be used in data cleaning which includes filtering data and handling missing values.
- Writing scripts using Python which shall do repetitive tasks in Excel which might include filling cells and drawing charts.
- Using Python in Excel to create predictive models which shall be used in forecasting future data using the historical data that is stored in Excel.
Tips and Best Practices
The following are tips to get the best out of leveraging Python with Excel.
- Learning the basics of Python language and its syntax if it is a new language. Many resources are found on the internet.
- Understanding the basic Python functions that are used in Excel which are the PY function and X1 function.
- Learning anaconda which uses powerful libraries like Pandas and Matplotlib.
- Engaging with the community either through forums or social media to learn more about Python in Excel.
Benefits of Using Python in Excel
- Advanced data analysis, with Python in Excel powerful libraries like a sci-kit-learn model can be accessed does enhance data prediction.
- Data protection, Python on Excel only work on Microsoft cloud which has high enterprise security.
- Creating advanced visuals like network graphs and swarm plots with access to Python libraries from Excel.
- Automation of tasks in Excel using Python scripts.
Python Libraries Compatible with Excel
Python has so many libraries the following are compatible with Excel.
- Matplotlib – used for plotting animated visualizations.
- NumPy – mostly used for computations.
- Pandas – used for data analysis.
- Seaborn –used for drawing high-level and interactive graphs.
Example: Data Analysis with Python in Excel
Analysis of data in Excel using Python in Excel can easily be done using the X1 Python function that is already configured in Excel as shown in the following figure. In the attached figure the X1 python function is used in selecting data from Excel cells grouping them according to categories and finding their mean. The final results are then printed on Excel and a bar graph is drawn to visualize the results. This can be shown in the following figure 4.
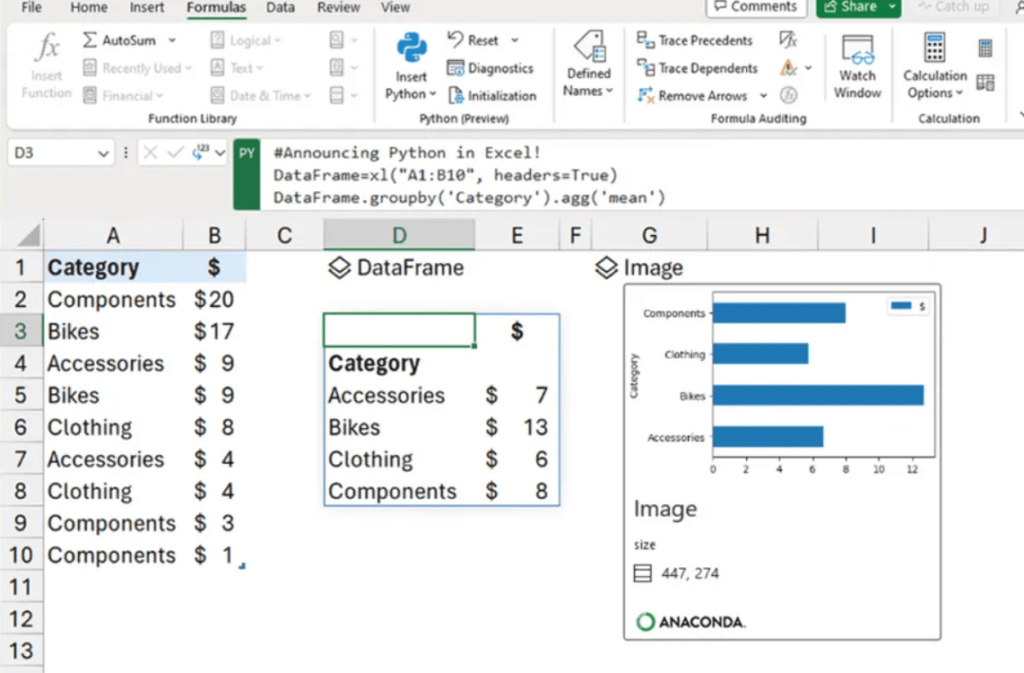
Figure 4: data analysis
Overcoming Common Challenges
The following are some of the challenges that must be addressed to integrate Python into Excel.
- Resizing plots drawn by Python to make sure that they fit the size of Excel.
- Import all the packages that are required to integrate Python in Excel to make sure that there are no errors while running the scripts.
- Improving the speed of calculation, sometime Python code can slow down the speed of Excel, the codes should be optimized to make sure that they take little time to be executed.
- Understanding the PY function and X1 function to avoid errors while integrating Python in Excel.
FAQ
- How do I integrate Python with Excel?
Python can be integrated into Excel in the following ways.
- Select the cell in Excel where you want to insert Python go to the formulas section in the Excel file and click on insert Python function. The Python function shall be inserted in the cell and Python codes can be written in it.
- Through using the PY and X1 function. Once the functions have been written in the cells in Excel, they allow Python scripts to be written.
- What are the benefits of using Python in Excel?
- Automation of repetitive tasks using Python scripts in Excel.
- Data protection and privacy since Python only runs on the cloud which is highly secured.
- Advanced data analysis since powerful Python libraries like Pandas can be accessed from Excel.
- Creation of advanced network visuals like network graphs and swarm plots which cannot be drawn in Excel.
- Which Python libraries are compatible with Excel?
Some of the Python libraries that are compatible with Excel include:
- NumPy- which is mostly used for scientific computations.
- Pandas – used for data analysis.
- Matplotlib- used for drawing interactive charts.
- Seaborn- used for drawing graphs.